✅ Step 1: Introduction to Microsoft Excel | What is MS Excel?
📌 What is Microsoft Excel? | Basics of Excel | | Uses, Features & Benefits Explained (2025)
🧾 What is Microsoft Excel? | A Complete Beginner’s Guide (2025)
Microsoft Excel is a spreadsheet software developed by Microsoft, widely used for data entry, calculation, analysis, and visualization. It is part of the Microsoft Office Suite and runs on Windows, Mac, and even mobile devices. Excel is extensively used across businesses, educational institutions, and households.
Whether you’re a student, business owner, data analyst, or job seeker, Excel is an essential tool for organizing and managing data efficiently. Whether you’re managing your monthly budget or working on large-scale financial analysis, Excel makes handling data easier, faster, and more systematic.
🔍 Why is Microsoft Excel So Popular?
Excel is trusted by over 750 million users worldwide for personal and professional tasks. Its popularity comes from its versatility, ease of use, and powerful built-in tools.
✅ Key Benefits of Microsoft Excel:
-
Organize large data sets in rows & columns
-
Perform calculations using formulas and functions
-
Create visual reports using charts and graphs
-
Automate repetitive tasks with macros
-
Analyze data trends using pivot tables & filters
🎯 Key Uses of Excel
Here are some of the most common tasks people use Excel for:
| Purpose | Examples |
|---|---|
| 💼 Business | Sales reports, invoices, financial modeling |
| 🎓 Education | Grading systems, attendance, student reports |
| 📊 Data Analysis | Charts, pivot tables, trend tracking |
| 📋 Personal Use | Monthly budgets, checklists, expense tracking |
| 🤖 Automation | Repetitive task automation with formulas/macros |
🧑💻 Why Should You Learn Excel?
Learning Excel isn’t just for accountants or data analysts. It improves your productivity, helps in data-driven decision-making, and adds strong value to your resume.
Benefits include:
-
Speed up repetitive tasks using formulas and shortcuts
-
Convert raw data into insightful charts
-
Use built-in tools like conditional formatting to highlight key information
-
Analyze trends and patterns using data filtering, sorting, and pivot tables
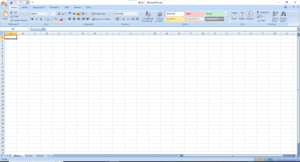
🖥️ Understanding the Microsoft Excel Interface
When you open Excel, you’ll see a clean, grid-like interface made of rows and columns along with multiple tabs and tools. x
Here’s a breakdown of its key components:
🔹 1. Workbook
A workbook is the complete Excel file. It can contain multiple worksheets (tabs) inside it.
-
A workbook is an Excel file.
-
File extension:
.xlsx -
It can contain multiple worksheets
📂 Example: Sales_Report_2025.xlsx, Income_Report_2025.xlsx
🔹 2. Worksheet
Each worksheet is a grid where you enter and manipulate data. It consists of cells arranged in rows and columns.
-
A worksheet is a single tab inside a workbook.
-
Each sheet is made up of rows and columns.
-
You can rename worksheets and add/delete them.
📄 Example: Sheet1, Sheet2, Sheet3
🔹 3. 🎛️ Ribbon
The toolbar at the top of the Excel window. It’s divided into tabs like:
-
Home: Font Formatting, alignment, font styles, number formatting
-
Insert: Charts, tables, shapes, images
-
Formulas: Built-in Excel functions
-
Data: Sorting, filtering, data validation
-
Review/ View: Comments, Zoom, freeze panes
🔹 4. Formula Bar
Located above the worksheet, it shows the content or formula of the selected cell. This is where you type in your formulas.
-
Shows or lets you type data or formulas in a cell.
-
Every formula in Excel starts with
=
➤ Example:=SUM(A1:A5)
🔹 5. 🔠 Cells, Rows & Columns
-
Rows run horizontally and are labeled with numbers (1, 2, 3…)
-
Columns run vertically and are labeled with letters (A, B, C…)
-
Cells are the intersection of rows and columns, like A1, B2, etc.
Columns: Labeled A, B, C… vertically
Rows: Numbered 1, 2, 3… horizontally
Cell: Where a row and column meet (e.g., A1, B2)
🧪 Try This: Click on cell A1 and type Hello Excel, then hit Enter.
🔠 3. Columns, Rows & Cells
-
Columns: Labeled A, B, C… vertically
-
Rows: Numbered 1, 2, 3… horizontally
-
Cell: Where a row and column meet (e.g., A1, B2)
🧪 Example: Cell B2 contains a number like 500.
🛠️ Real-Life Example: Creating a Simple Contact List
| Name | Phone | |
|---|---|---|
| Oindrila Baisnab | oindrila@example.com | xxxxxxxxxx |
| Ankit Das | ankit@example.com | xxxxxxxxxx |
You can apply bold formatting to headers, adjust column width, and even create filters to sort by names.
💡 Quick Start: Create Your First Excel Table
Try this to get hands-on experience:
| Name | Marks |
|---|---|
| Rina | 85 |
| Amit | 90 |
➡ Type “Name” in A1, “Marks” in B1
➡ Fill the rows below
➡ Use Bold, Center Align, and AutoFit Column Width
📊 What Makes Excel Different from Google Sheets?
| Feature | Microsoft Excel | Google Sheets |
|---|---|---|
| Offline Support | Yes (Full) | Limited |
| File Size Capacity | Higher | Moderate |
| Advanced Tools | Strong (Pivot, Power Query) | Basic |
| Collaboration | Moderate (via OneDrive) | Strong (Real-time) |
🔎 Fun Fact:
Excel was first released in 1985 for the Macintosh, and the Windows version followed in 1987. Since then, it has become a standard tool in offices across the world!
📥 Practice Task for Beginners
-
Open Excel and create a new blank workbook
-
In cell A1, type:
Name -
In cell B1, type:
Marks -
Enter two names and marks in rows below
-
Try using bold, center align, and auto-fit column width
.📥 Download Practice File (Optional)
👉 Want a sample .xlsx file to practice basic tables and formatting?
📧 Comment below or subscribe to get free Excel files weekly!
🧭 🚀 What’s Next?
🎓 Now that you understand what Excel is and how it works, let’s move to the next step:
🔗 Step 2: Understanding Excel Workbook & Worksheet